Middle Market Commentary – 1H 2025
Middle market M&A activity staged a notable rebound in the first half of 2025, following a sluggish start to the year.
Insights provided by Charles Craig
Lower Middle Market Snapshot: Early 2025
In 2024, the lower middle market (enterprise values between $10 million and $250 million) emerged as a bright spot amid challenging macro conditions. According to PitchBook’s Annual PE Middle Market Report, middle market deals accounted for 60% of all private equity buyouts in 2024—demonstrating the segment’s resilience.
Tight debt markets, compressed valuations, and widening bid-ask spreads pushed private equity firms to shift their focus to smaller add-on acquisitions, emphasizing incremental growth over new platform deals that require external financing. This dynamic drove activity toward the middle market.
Add-on activity, however, slowed heading into 2025, accounting for 40% of buyouts year-to- date, down slightly from the mid-2024 peak of 44% (Source: GF Data, Q2 2025 M&A Report). While add-ons briefly surpassed platforms in valuation during Q1’25 (7.7x vs 7.6x), that dynamic has now reversed, as both now average 7.2x in 1H‘25, reflecting a return toward historical norms. Improved debt availability and renewed lender competition have further reinforced private equity buyer appetite for platform investments.
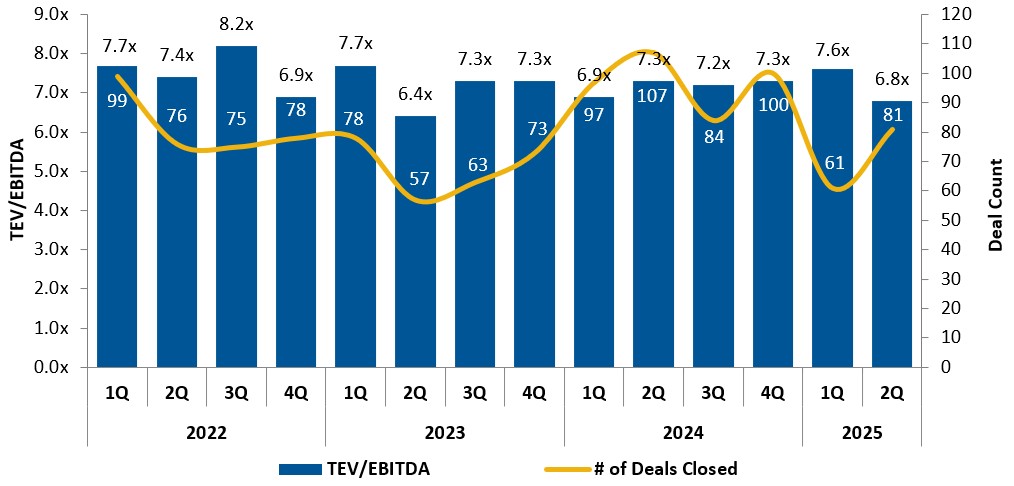
Deal volume fell nearly 40% in Q1’25 from the prior quarter, amid broader regulatory (tariff) and economic uncertainty. However, valuations remained strong, representing a flight to quality with average multiples rising to 7.6x TTM Adjusted EBITDA,—the highest quarterly average since mid-2022, a period characterized by feverish post-COVID activity.
Deal Rebound and Valuation Reset: 1H 2025
The market quickly recovered in Q2’25. GF Data reported a sequential 33% increase over Q1’25 (81 vs 61 deals). Even so, total 1H‘25 activity—142 deals—remains 30% lower than the 204 completed in 1H‘24, which should provide incremental support for deal flow heading into Q3’25 – suggesting that the market needs to pick up the pace.
The rapid thawing in Q2’25 also led to lesser quality assets entering the market, dragging overall deal valuations down. Average purchase price multiples fell to 6.8x in Q2’25—the steepest quarter-over-quarter decline since early 2023, bringing the rolling four-quarter average down slightly to 7.2x from 7.3x in Q1’25.
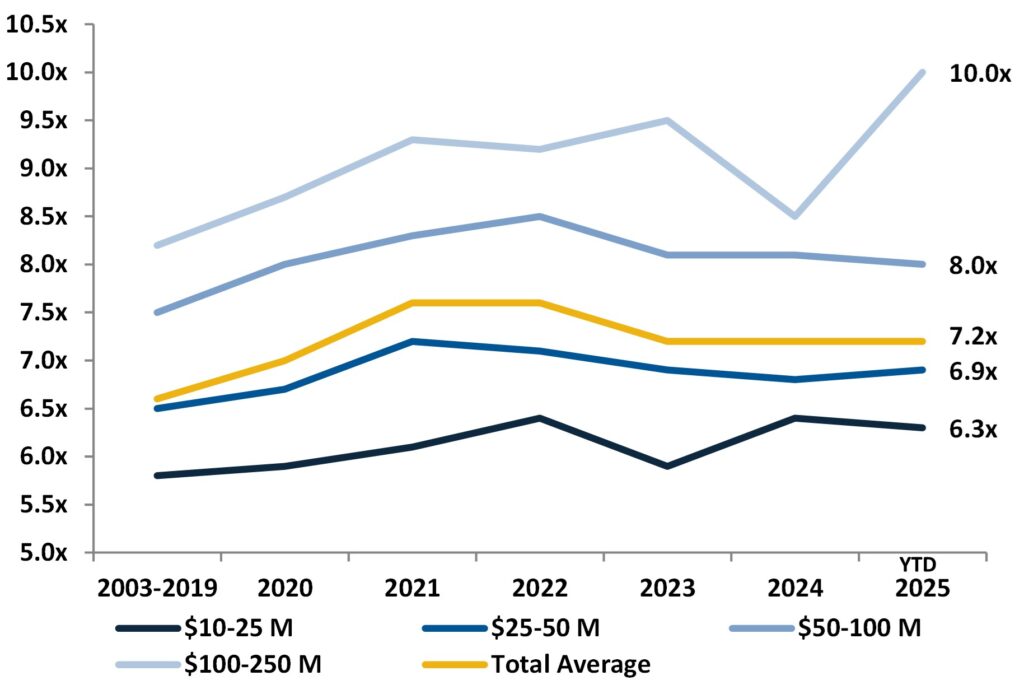
Valuation spreads held steady across the lower middle market, with the exception of the $100 million–$250 million tier, which increased to a 10.0x multiple, more in line with its long-run slope. Since 2019, this cohort has experienced the greatest valuation growth among its peers, gaining two full turns in five years. This underscores the private equity market’s perception that size equals stability. Still, under the $100 million EV ceiling, the relative spread across smaller deal sizes remained stable.
Sector Highlights
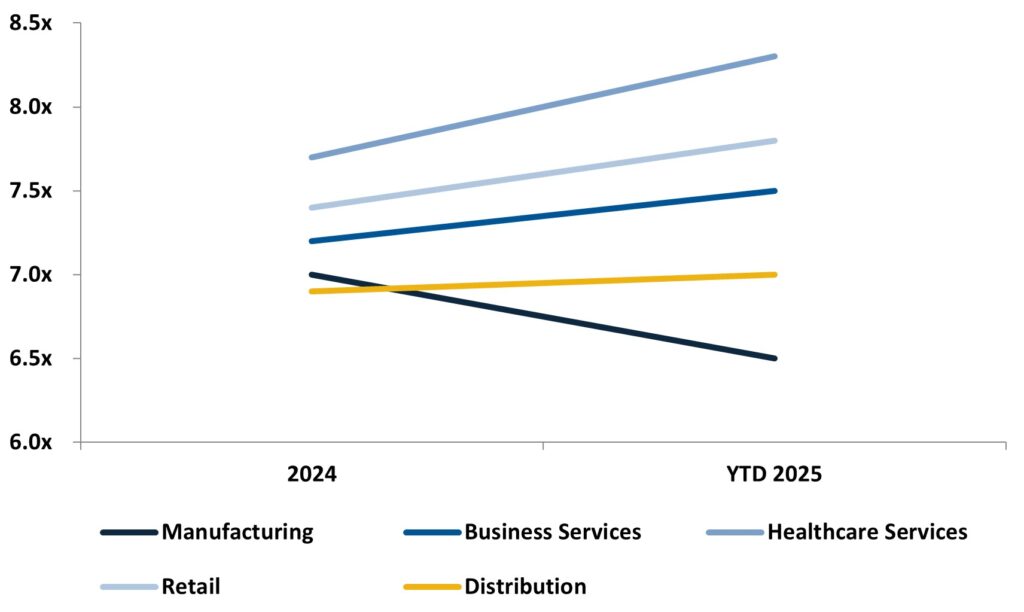
GF Data recorded the highest sector valuation multiples in 1H’25 in healthcare (8.3x), retail (7.8x), business services (7.5x), distribution (7.0x), and manufacturing (6.5x). Most sectors have experienced sequential improvements since 2024. Notably, retail’s rebound to 7.8x signals early signs of recovery despite continued tariff uncertainty while manufacturing’s decline represents a reversion to the long-term mean.
There has been a noticeable quickening in buyer interest around services, as goods producers continue to grapple with global trade uncertainty. According to GF Data, the business services sector is trading at a half-turn above their long-term average in YTD 2025. In our conversations with prospective investors, the following sub-sectors have drawn particular interest:
- Professional Services
- Residential Services
- Infrastructure Services (Power, Water, Data)
- Domestic Manufacturers
The Lending Environment
Rising add-on activity over the past six quarters has pushed overall debt levels higher, though platform leverage has remained relatively steady. Lenders remain more aggressive at the upper end of the market while scaling back on smaller, riskier platforms. Subordinated debt providers, meanwhile, are demanding higher returns despite easing senior pricing, reflecting persistent risk concerns. Sponsors are increasingly filling capital structure gaps with subordinated instruments, while unitranche and non-bank lenders command premiums even as banks re-enter the market and intensify competition.
According to GF Data, debt financing conditions continued to ease in 1H 2025:
- Average total debt: 4.0x TTM EBITDA (up from 3.7x in 2024)
- Average senior debt: 3.1x (down from 3.4x in Q1’25, but near historical norms)
- Subordinated debt pricing: averaged 12.1% (highest since Q4’23)
- Equity contributions: 57.3% (remains elevated)
Following aggressive Fed rate hikes in late 2022, senior lending tightened, forcing many borrowers to seek out higher-cost, non-bank lenders. Larger platform transactions were most affected, given their reliance on shorter-term borrowings with more aggressive leverage structures. Conditions began shifting in Q3’24 as the Fed implemented rate cuts to stimulate growth, prompting senior lenders to re-enter the market more competitively, particularly in platform financing.
In contrast, much of the 1H’25 deal flow in the middle market has been sustained by add-on investments. These smaller transactions are often funded through existing platform credit facilities, enabling private equity sponsors to pursue cost-effective growth strategies without taking on new, expensive debt.
Middle Market Outlook: 2H 2025
Despite a slow start to the year, the appetite for middle market deals remains strong, particularly for high-quality, founder-owned businesses in resilient (regulatorily insulated) sectors. A growing backlog of potential platform deals, combined with ample available capital, is expected to drive a continued acceleration in M&A activity over the next two quarters.
That said, even with the rebound in deal volume observed in Q2, seller hesitation among financially stronger companies, driven by macro uncertainty, could constrain the supply of premium assets and apply downward pressure on valuations even amid steady buyer demand.
At a more localized level, GulfStar has experienced consistently strong M&A activity since mid-2022. While 2023 marked a record year for our firm, 2025 is on track to significantly surpass it, both in transaction volume and total deal value. Heading into 2026, our current backlog suggests continued momentum as we bring high-quality businesses to market.
If you or your clients are considering a sale or acquisition in any of the following sectors, we would welcome the opportunity to connect:
- Industrial Services & Manufacturing
- Business Services
- Energy, Power, & Infrastructure
- Consumer Products & Services
- Specialty Distribution
- Environmental & Sustainability
- Software & Tech-Enabled Services
- Healthcare
About the Data
This commentary summarizes middle market activity through June 30, 2025. GF Data, the primary source for lower middle market insights, collects quarterly reports covering M&A activity, leverage trends, and key deal terms. In 1H 2025, GF Data compiled insights from 334 active private equity groups on 81 completed transactions in the $10–$500 million TEV range, with EBITDA multiples spanning 3.0x–18.0x. GulfStar continuously monitors these trends to provide business owners and clients with a clear and current view of market conditions and transaction opportunities.